Events
The Tauber Institute hosts events for students, alumni, the University of Michigan community, and the general public. Tauber Institute faculty and staff also present at industry conventions and academic symposiums throughout the year.
The Tauber Institute hosts events for students, alumni, the University of Michigan community, and the general public. Tauber Institute faculty and staff also present at industry conventions and academic symposiums throughout the year.
Focus:HOPE is a Detroit-based civil and human rights organization dedicated to intelligent and practical action to overcome racism, poverty and injustice.
Focus:HOPE trains metal working machinists but has little retail presence. This year student teams were asked to design a retail brand/product line for Focus:HOPE, and to design and manufacture ONE product from the line. This one product must use the installed machining assets and machinist trainees in Focus:HOPE’s Machinist Training Institute.
Click for past IPD trade shows
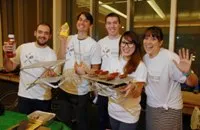
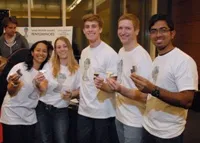
View photos from On-Campus Trade show
Read about Teaching Innovation Prize winning Faculty
The instructors received extremely enthusiastic feedback on the trade show this year. Even people who had already voted on the web were not fully expecting the well designed products and professional presentations by all teams. Congratulations on completing a very difficult design challenge in great style! Following are the quantitative results of the trade show competitions. As noted previously, this is just one input into team grading this year.
The web show market shares based on 678 valid votes were as follows:
| First place votes | Market share | Unit sales | |
|---|---|---|---|
| Go-Wagon | 45 | 6.6% | 664 |
| Pentominoes | 66 | 9.7% | 973 |
| Grill'ON | 167 | 24.6% | 2463 |
| Creative Desk Org | 55 | 8.1% | 811 |
| Make it Stick | 84 | 12.4% | 1239 |
| SideSaddle | 102 | 15.0% | 1504 |
| tilt | 74 | 10.9% | 1091 |
| clink! | 46 | 6.8% | 678 |
| Streets D Chainring | 39 | 5.8% | 575 |
307 valid votes were cast in the physical trade show, with the following market share and (potential) unit sales results:
| First place votes | Market share | Unit sales | |
|---|---|---|---|
| Go-Wagon | 21 | 6.8% | 684 |
| Pentominoes | 13 | 4.2% | 423 |
| Grill'ON | 73 | 23.8% | 2378 |
| Creative Desk Org | 28 | 9.1% | 912 |
| Make it Stick | 32 | 10.4% | 1042 |
| SideSaddle | 33 | 10.7% | 1075 |
| tilt | 34 | 11.1% | 1107 |
| clink! | 31 | 10.1% | 1010 |
| Streets D Chainring | 42 | 13.7% | 1368 |
These potential sales were not fully realized due to some teams stocking out, as described below.
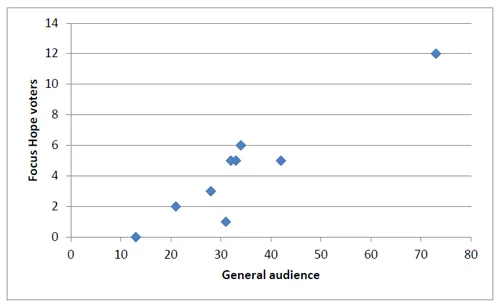
We also had 39 guests from Focus:HOPE reviewing the products and voting, and their preferences tracked the general audience preferences very closely (correlation coefficient .93).
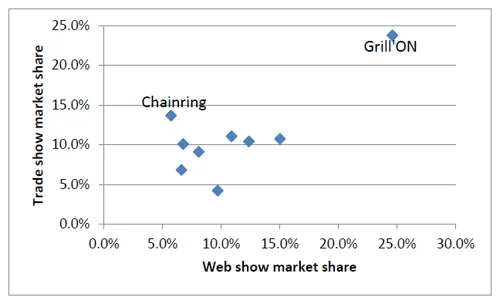
The web and trade show market shares were positively correlated (correlation coefficient .75), but there were some products that experienced surprises. For example, Streets of the D Chainring did much better in the physical trade show than on the web. This surprise did, in fact, have consequences: Chainring stocked out, as did Grill’ON.
Grill’ON had 278 units of excess demand(demand that they could not fill due to stocking out of inventory) and Chainring had 343 units of excess demand that had to be distributed among the other products. To complicate things further, Chainring was a very highly rated second choice among all Grill’On customers, and vice versa! So, we had to go to third place choices among customers who chose Grill’On first and Chainring second, or vice versa, to distribute the 621 units of excess demand. The big winner in that redistribution was Make it Stick, however most teams picked up some demand.
After all redistributions were complete, final sales figures in the physical trade show were as follows:
| Team | Total trade show unit sales | Market share |
|---|---|---|
| Go-Wagon | 768 | 7.7% |
| Pentominoes | 504 | 5.0% |
| Grill'ON | 2100 | 21.0% |
| Creative Desk Org | 984 | 9.8% |
| Make it Stick | 1196 | 12.0% |
| SideSaddle | 1152 | 11.5% |
| tilt | 1206 | 12.1% |
| clink! | 1066 | 10.7% |
| Streets D Chainring | 1025 | 10.2% |
The fixed and variable costs for the products this year were as follows:
| Fixed cost | Variable cost | Web price | Trade show price | Web margin | Trade show margin | |
|---|---|---|---|---|---|---|
| Go-Wagon | 6699 | 72.96 | 99.95 | 99.95 | 26.99 | 26.99 |
| Pentominoes | 0 | 22.1 | 85 | 85 | 62.90 | 62.90 |
| Grill'ON | 0 | 37.32 | 69.99 | 79.99 | 32.67 | 42.67 |
| Creative Desk Org | 0 | 12.1 | 39 | 49.99 | 26.90 | 37.89 |
| Make it Stick | 0 | 30.47 | 59.99 | 59.99 | 29.52 | 29.52 |
| SideSaddle | 2500 | 49.18 | 85 | 95 | 35.82 | 45.82 |
| tilt | 548.18 | 15.29 | 49 | 49 | 33.71 | 33.71 |
| clink! | 2913 | 41.62 | 55 | 55 | 13.38 | 13.38 |
| Streets D Chainring | 3188.45 | 14.84 | 49 | 59 | 34.16 | 44.16 |
The thin margins for clink! and Go-Wagon will have profitability consequences.
To compute final team profits, first all teams were charged their fixed costs (just once), and then they paid their variable cost for each unit of inventory built. Revenues were computed from the unit sales in a show (web or trade show) multiplied by the price in that show. As announced in class, we weight the physical and web trade shows 2/3 and 1/3, respectively when computing final profits. The teams are listed from most to least profitable, along with the web and trade show market shares, in the following table:
| Team | Web show market share | Trade show market share | Final profits ($) |
|---|---|---|---|
| Grill'ON | 24.6% | 23.8% | 168 616 |
| SideSaddle | 15.0% | 10.7% | 93 194 |
| tilt | 10.9% | 11.1% | 72 762 |
| Streets D Chainring | 5.8% | 13.7% | 72 474 |
| Make it Stick | 12.4% | 10.4% | 69 005 |
| Creative Desk Org | 8.1% | 9.1% | 62 359 |
| Pentominoes | 9.7% | 4.2% | 57 012 |
| clink! | 6.8% | 10.1% | (3 940) |
| Go-Wagon | 6.6% | 6.8% | (24 309) |
Charging the cost of capital (as established in the second design review) for all expenditures does not change anything substantially, however Streets of the D is able to move ahead of tilt because of the lower level of total expenditures on which they have to pay interest. After making this adjustment, the final profits are:
| Team | Profits adjusted for cost of capital |
|---|---|
| Grill'ON | 160,737.93 |
| SideSaddle | 86,185.19 |
| tilt | 71,251.31 |
| Streets D Chainring | 70,885.08 |
| Make it Stick | 64,434.67 |
| Creative Desk Org | 61,607,07 |
| Pentominoes | 54,332.62 |
| clink! | (8,753.68) |
| Go-Wagon | (32,596.10) |
Despite their low margins, both clink! and Go-Wagon would have been substantially profitable but for the expense of unsold inventory. Specifically, here are the overstocking numbers:
| Team | How much did teams overstock? | Variable cost | Loss ($) |
|---|---|---|---|
| Go-Wagon | 818 | 72.96 | 59,716 |
| Pentominoes | 102 | 322.12 | 2,602 |
| Grill'ON | 0 | 37.32 | - |
| Creative Desk Org | 216 | 12.1 | 2,611 |
| Make it Stick | 65 | 30.47 | 1,995 |
| SideSaddle | 98 | 49.18 | 4,825 |
| tilt | 39 | 415.29 | 6,020 |
| clink! | 75 | 641.62 | 31,461 |
| Streets D Chainring | 0 | 14.84 | - |
A combination of high variable costs and high overstocking is very costly. But this is not the whole story this year. A regression of profits as a function of intuitive drivers such as market share, variable cost, margin, and stockouts shows no significant variables. That is, these issues do not separate out in any easy way. It is the interactions among all of these variables that explains the results this year.
For more information about the IPD trade shows or course, please contact Tauber at (734) 647-0308 or email [email protected].